Reports
DiKAS offers six report types for analyzing your revenue and operational data — from daily evaluations to annual overviews with year-over-year comparisons.
Admin → Reports
1. Revenue Report
Detailed revenue analysis by time period, broken down by tax rates and payment methods.
Filters
| Filter | Description |
|---|---|
| Time Period | From-to date |
| Article Group | Optional: Only specific article groups |
Display
Umsatzbericht: 01.03. – 31.03.2026

              Brutto       MwSt      Netto
19 %:      8.345,20 €  1.332,64 €  7.012,56 €
 7 %:      3.217,50 €    210,51 €  3.006,99 €
 0 %:        450,00 €      0,00 €    450,00 €
────────────────────────────────────────────────
Gesamt:   12.012,70 €  1.543,15 € 10.469,55 €

Zahlungsarten:
  Bar:                 6.789,30 €  (56,5 %)
  EC-Karte:            4.123,40 €  (34,3 %)
  Kreditkarte:           650,00 €  (5,4 %)
  Kundenguthaben:        250,00 €  (2,1 %)
  Gutschein:             200,00 €  (1,7 %)

Sonstiges:
  Rabatte:               345,00 €
  Trinkgeld:             189,50 €
  Stornos:        4       42,30 €
  Belege:       312
Included Key Figures
| Key Figure | Description |
|---|---|
| Gross / Net / VAT | Separated by tax rate (19%, 7%, 0%) |
| Payment Methods | Breakdown by method with percentage share |
| Discounts | Total amount of discounts granted |
| Tips | Sum of all tips |
| Voids | Count and amount |
| Receipt Count | Total number of receipts in the period |
2. Best & Worst Sellers (Article Statistics)
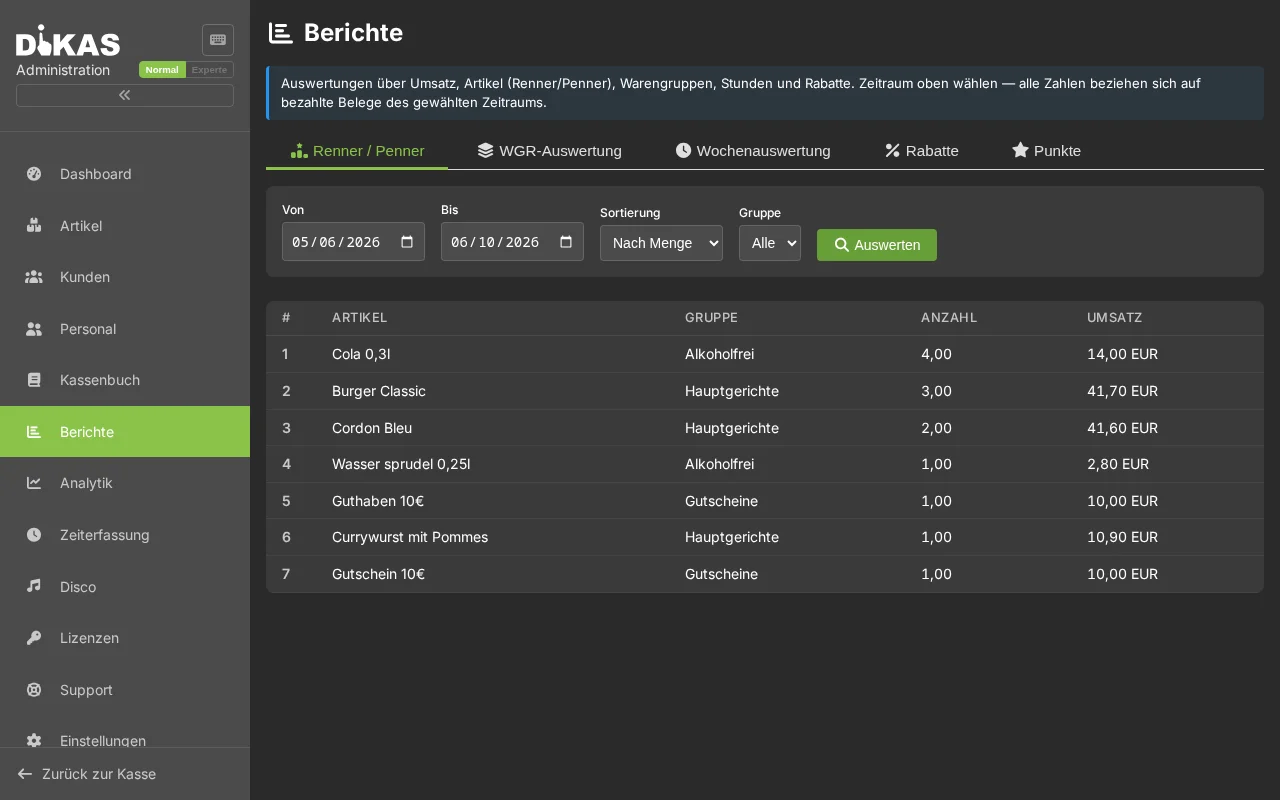
Shows the best-selling and least-selling articles — ideal for menu optimization.
Filters
| Filter | Description |
|---|---|
| Time Period | From-to date |
| Sort By | By quantity (bestseller) or by revenue |
| Limit | Top N articles (default: 50) |
| Article Group | Optional: Only specific groups |
Display
Best Sellers (Top 10):
| Rank | Article | Group | Quantity | Revenue |
|---|---|---|---|---|
| 1 | Weizen 0,5l | Bier | 234 | 982,80 € |
| 2 | Cola 0,3l | Softdrinks | 198 | 693,00 € |
| 3 | Pizza Margherita | Speisen | 156 | 1.482,00 € |
| 4 | Cappuccino | Kaffee | 134 | 469,00 € |
| 5 | Schnitzel | Speisen | 98 | 1.470,00 € |
Worst Sellers (Bottom 10):
| Rank | Article | Group | Quantity | Revenue |
|---|---|---|---|---|
| 1 | Grüner Tee | Tee | 2 | 5,60 € |
| 2 | Milchshake Vanille | Desserts | 3 | 13,50 € |
| 3 | Tonic Water | Softdrinks | 4 | 14,00 € |
Purpose: Remove worst sellers from the menu or reposition them. Place best sellers more prominently or review their margins.
3. Article Group Analysis
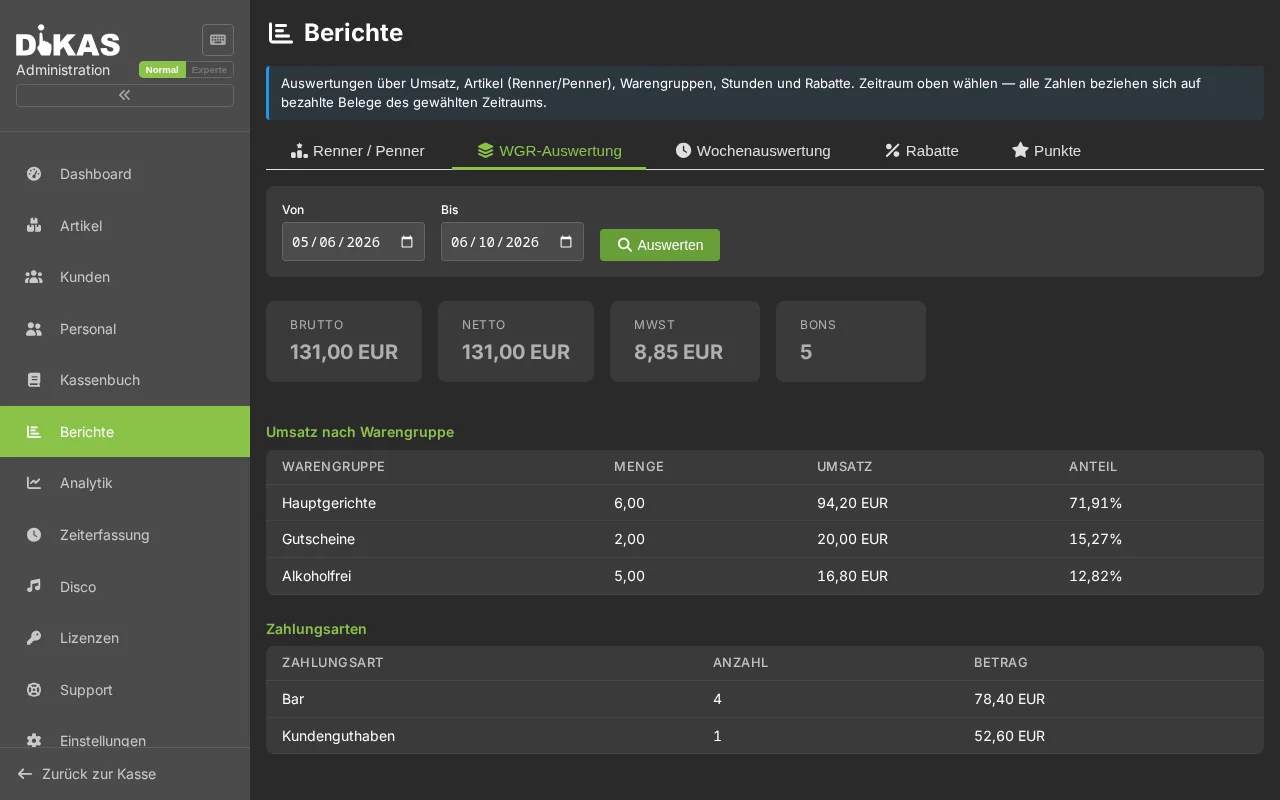
Revenue per article group with percentage share — shows which areas drive revenue.
Display
Warengruppen: März 2026

Getränke alkoholfrei:   3.450,00 €  ████████████░░░░  (28,7 %)
Getränke Bier:          2.890,00 €  ██████████░░░░░░  (24,1 %)
Speisen Hauptgericht:   3.120,00 €  ███████████░░░░░  (26,0 %)
Speisen Vorspeisen:       980,00 €  ████░░░░░░░░░░░░  (8,2 %)
Getränke Wein:            890,00 €  ███░░░░░░░░░░░░░  (7,4 %)
Desserts:                 682,70 €  ██░░░░░░░░░░░░░░  (5,7 %)
4. Hourly Revenue Analysis
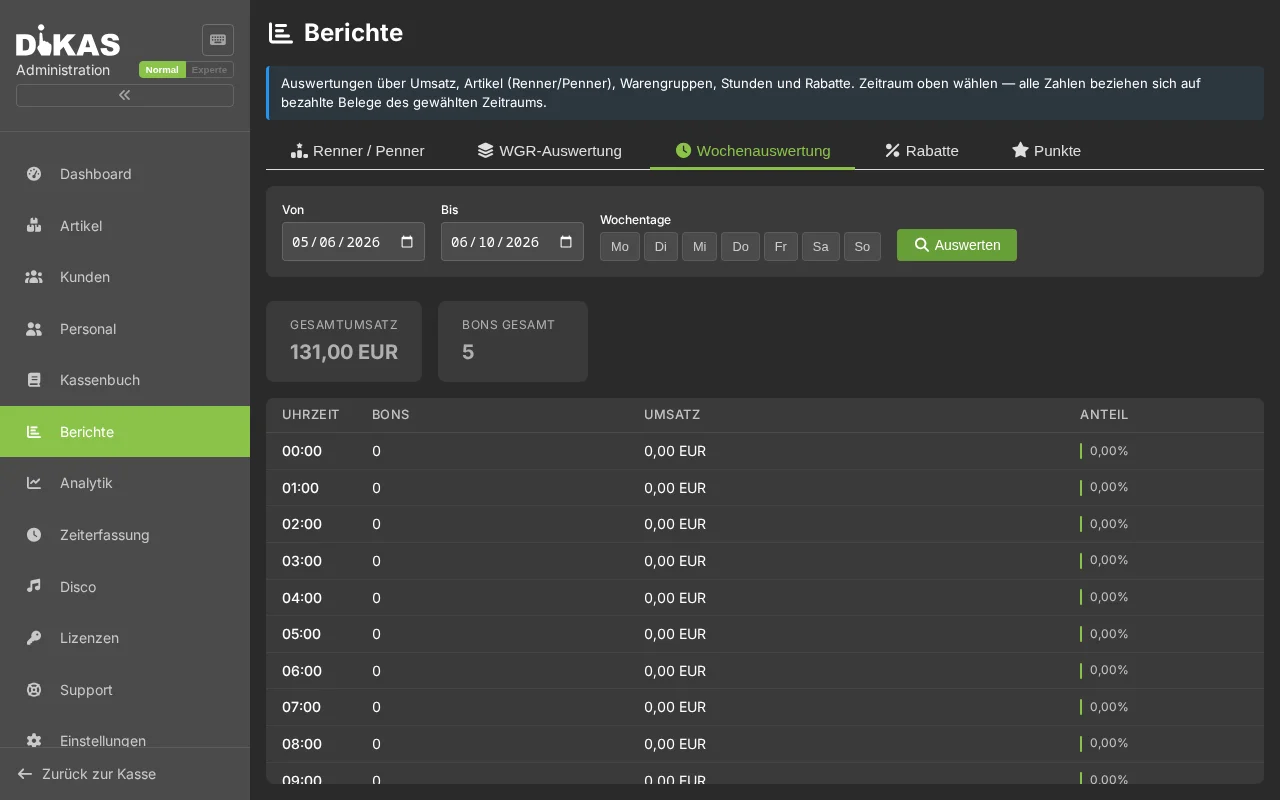
Revenue by hour of day — shows when your business generates the most revenue.
Filters
| Filter | Description |
|---|---|
| Time Period | From-to date |
| Weekdays | Optional: Only specific weekdays (e.g. Friday + Saturday only) |
Display
Stündliche Auswertung: März 2026

Stunde  Bons    Umsatz        Anteil
 8:00      5      42,50 €     ░░  (0,4 %)
 9:00     12     134,80 €     █░  (1,1 %)
10:00     18     215,40 €     ██  (1,8 %)
11:00     34     478,90 €     ████  (4,0 %)
12:00     67   1.245,00 €     ██████████  (10,4 %)
13:00     58   1.034,20 €     █████████  (8,6 %)
14:00     23     312,00 €     ███  (2,6 %)
...
18:00     45     890,00 €     ████████  (7,4 %)
19:00     72   1.567,00 €     ████████████  (13,0 %)
20:00     68   1.423,50 €     ████████████  (11,9 %)
21:00     42     987,00 €     ████████  (8,2 %)
22:00     18     345,00 €     ███  (2,9 %)
Purpose: Optimize staff scheduling — more employees during peak hours, fewer during off-peak hours.
Weekday Filter: Filter e.g. only Friday and Saturday to see whether extended opening hours on weekends are worthwhile.
5. Workstation Report
Revenue per register/workstation — useful for businesses with multiple registers:
| Workstation | Receipts | Revenue | Share |
|---|---|---|---|
| Kasse 1 (Theke) | 145 | 4.567,00 € | 42,7% |
| Kasse 2 (Terrasse) | 98 | 3.234,50 € | 30,2% |
| Kasse 3 (Bar) | 67 | 2.890,00 € | 27,0% |
6. Financial Overview (Annual Report)
Comprehensive annual report with optional year-over-year comparison.
Filters
| Filter | Description |
|---|---|
| Year | Reporting year |
| Comparison Year | Optional: Year-over-year comparison (e.g. 2025 vs. 2024) |
Annual Key Figures
| Key Figure | Description |
|---|---|
| Total Revenue | Annual revenue (gross) |
| Total Costs | Sum of all expenses |
| Profit | Revenue − costs |
| Profit Margin | Profit / Revenue × 100 |
| Receipt Count | Total number of receipts in the year |
| Business Days | Number of days with revenue |
| Average/Day | Revenue / business days |
| Average/Receipt | Revenue / receipt count |
Monthly Overview
| Month | Revenue | Costs | Profit | Change |
|---|---|---|---|---|
| Jan | 11.234 € | 3.456 € | 7.778 € | +5,2% |
| Feb | 10.890 € | 3.210 € | 7.680 € | −1,3% |
| Mar | 12.012 € | 3.890 € | 8.122 € | +12,4% |
| ... |
The "Change" column shows the percentage difference to the comparison year (if specified).
Additional Analyses
| Section | Content |
|---|---|
| Revenue by Article Group | Group revenue with percentage share |
| Costs by Category | Expense categories with percentage share |
| Payment Methods Overview | Method, amount, count, percentage |
| Tax Summary | Net, tax, gross per tax rate |
| Open Items | Outstanding invoices by dunning level and due date buckets |
Open Items (Due Date Buckets)
| Bucket | Description |
|---|---|
| Overdue | Already past due |
| 7 Days | Due within 7 days |
| 14 Days | Due within 14 days |
| 30 Days | Due within 30 days |
| 60 Days | Due within 60 days |
| 60+ Days | Due after more than 60 days |
Loyalty Points Report
Under Admin → Reports → Points you will find the loyalty points program analysis:
| Key Figure | Description |
|---|---|
| Points in Circulation | Total of all unredeemed points |
| Points Earned | Points earned in the period |
| Points Redeemed | Points redeemed in the period |
| Discount Value | Monetary value of redeemed points |
Top Customers (Points)
| Customer | Total Points | Earned | Redeemed |
|---|---|---|---|
| Frau Weber | 342 | 187 | 45 |
| Herr Schmidt | 256 | 134 | 22 |
| Familie Müller | 198 | 98 | 50 |
Report Filters
All reports support these common filters:
| Filter | Description |
|---|---|
| Time Period | From-to date (required) |
| Waiter | Only specific employees |
| Payment Method | Only cash / only card / etc. |
| Article Group | Only specific article groups |
Export
Reports can be exported:
| Format | Description |
|---|---|
| For printing or archiving | |
| Excel | For further processing in spreadsheets |
| DATEV | Directly for the tax advisor → DATEV Export |
Practical Example: Monthly Report
Situation: Restaurant manager wants to analyze March 2026.
- Revenue Report (01.03.–31.03.): Total revenue 12.012,70 €, 312 receipts
- Best & Worst Sellers: Weizen is the bestseller (234×), green tea is removed (2×)
- Hourly Analysis: Peak hours 12:00–13:00 and 19:00–21:00 → schedule one more part-timer on weekends
- Article Groups: Beverages make up 60% of revenue, food 40% → review beverage margins
- Financial Overview: March +12.4% vs. previous year → terrace opening has paid off
Frequently Asked Questions
Can I send reports automatically by email? The DATEV export can be sent to the tax advisor by email. For other reports, use the manual export (PDF/Excel).
How far back do the reports go? Reports access all stored POS data — there is no time limit.
Are voided receipts included in the reports? Voids are shown separately. The net revenue already accounts for voids (they are subtracted).
Next Step
→ Settings — System configuration